Iris数据集
Iris Dataset The Iris dataset was used in R.A. Fisher’s classic 1936 paper, The Use of Multiple Measurements in Taxonomic Problems, and can also be found on the UCI Machine Learning Repository.
It includes three iris species with 50 samples each as well as some properties about each flower. One flower species is linearly separable from the other two,but the other two are not linearly separable from each other.
The columns in this dataset are: Id, SepalLengthCm, SepalWidthCm, PetalLengthCm, PetalWidthCm, Species
Iris 数据集是一个非常经典的数据集,大名鼎鼎的统计学家 Fisher 就在他1936年的论文中使用了这个数据集。你同样可以在许多关于机器学习的书籍中发现它的身影。你很容易在 Kaggle 上找到这个数据集,同时它在 UCI Machine Learning Repository 上也是十分受欢迎的数据集。
以下是数据集的下载链接:
点击此处在 Kaggle 上 下载 Iris Species 数据集
点击此处在 UCI 上 下载 Iris 数据集
在整个数据集的分析过程中,我主要参考了 Python Data Visualizations | Kaggle 这篇文章。至于参考的其他文章和资料,我会一并放在博客的最后。
导入外部包和模块 1 2 3 4 5 6 7 8 9 10 11 12 13 14 import numpy as npimport pandas as pdimport matplotlib.pyplot as pltimport warnings warnings.filterwarnings("ignore" ) import seaborn as snssns.set_theme(style="white" , color_codes=True ) import os from io import BytesIOimport PIL.Image as Imageimport rpy2.robjects as robjects
NumPy库是 python 进行科学计算的基础库
Pandas是数据分析必不可少的库,提供了高性能,并且易于使用的数据存储结构 DataFrame 和 Series 结构
Matplotlib是常用的绘制的库,Seaborn是基于Matplotlib的图形可视化python包。 它提供了一种高度交互式界面,便于用户能够做出各种有吸引力的统计图表。
Rpy2的作用是链接python和R,使得在python环境下可以使用R中的命令和函数。(当然没有这个库并不影响我们进行正常的数据分析)
如果发现没有相应的库,可以在 Anaconda Prompt 使用 pip 进行下载(以 rpy2 为例):
导入数据文件 我将下载的 iris.csv 和 iris.data 文件和 python 脚本放在同一目录下,以下将展示这两种数据文件的导入
1 2 path = 'iris.csv' iris = pd.read_csv(path)
而 data 文件可以通过以下方式导入
1 2 path = 'iris.data' iris = pd.read_csv(path, sep=',' )
如果出现类似的报错 No such file or directory: 'iris.csv',那么检查一下当前工作目录 cwd (current working dictionary)
1 2 3 import os cwd = os.getcwd() print (cwd)
然后会发现自己的数据集文件并不在这里面,接着我们更改工作目录
1 os.chdir('这里输入你要的文件的完整路径' )
此时再重复之前第一步操作就可以了。
初步查看数据集信息 以下结果可以通过print函数进行输出
1 2 3 4 5 6 type (iris) iris.index iris.columns
1 2 3 4 5 6 Out[1 ]: <class 'pandas .core .frame .DataFrame '> RangeIndex (start=0 , stop=150 , step=1 )Index (['Id' , 'SepalLengthCm' , 'SepalWidthCm' , 'PetalLengthCm' , 'PetalWidthCm' , 'Species' ], dtype='object' )
数据集总共有6列,其中SepalLengthCm表示花萼长,SepalWidthCm表示花萼宽;PetalLengthCm表示花瓣长,PetalWidthCm表示花瓣宽;Species表示物种。
1 2 3 4 5 6 7 8 9 10 11 12 13 14 Out[2 ]: <class 'pandas .core .frame .DataFrame '> RangeIndex :150 entries, 0 to 149 Data columns (total 6 columns): --- ------ -------------- ----- 0 Id 150 non-null int64 1 SepalLengthCm 150 non-null float64 2 SepalWidthCm 150 non-null float64 3 PetalLengthCm 150 non-null float64 4 PetalWidthCm 150 non-null float64 5 Species 150 non-null object dtypes: float64(4 ), int64(1 ), object (1 ) memory usage: 7.2 + KB
iris.info()可以将前面很多信息都显示出来。同时注意到这个数据集没有缺失值,这非常好!
1 2 3 4 iris.head(5 ) iris.tail(5 )
1 2 3 4 5 6 7 8 9 10 11 12 13 14 15 Out[3 ] Id SepalLengthCm SepalWidthCm PetalLengthCm PetalWidthCm Species 0 1 5.1 3.5 1.4 0.2 Iris-setosa1 2 4.9 3.0 1.4 0.2 Iris-setosa2 3 4.7 3.2 1.3 0.2 Iris-setosa3 4 4.6 3.1 1.5 0.2 Iris-setosa4 5 5.0 3.6 1.4 0.2 Iris-setosa Id SepalLengthCm ... PetalWidthCm Species 145 146 6.7 ... 2.3 Iris-virginica146 147 6.3 ... 1.9 Iris-virginica147 148 6.5 ... 2.0 Iris-virginica148 149 6.2 ... 2.3 Iris-virginica149 150 5.9 ... 1.8 Iris-virginica
1 2 3 4 5 6 7 8 9 10 Out[4 ]: Id SepalLengthCm SepalWidthCm PetalLengthCm PetalWidthCm count 150.000000 150.000000 150.000000 150.000000 150.000000 mean 75.500000 5.843333 3.054000 3.758667 1.198667 std 43.445368 0.828066 0.433594 1.764420 0.763161 min 1.000000 4.300000 2.000000 1.000000 0.100000 25 % 38.250000 5.100000 2.800000 1.600000 0.300000 50 % 75.500000 5.800000 3.000000 4.350000 1.300000 75 % 112.750000 6.400000 3.300000 5.100000 1.800000 max 150.000000 7.900000 4.400000 6.900000 2.500000
describe()会自动给出样本的均值、标准差;极值、分位数信息
1 2 iris["Species" ].value_counts()
1 2 3 4 5 Out[5 ]: Iris-setosa 50 Iris-versicolor 50 Iris-virginica 50 Name: Species, dtype: int64
Iris 数据集总共有150个数据,其中包括3个物种setosa,versicolor和virginica,每个物种各50个样本。
Show Output
还没搞清楚怎么操作
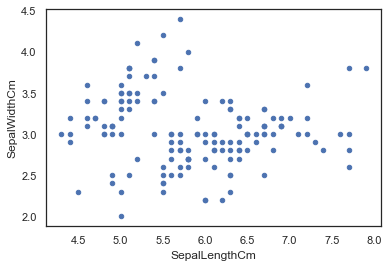
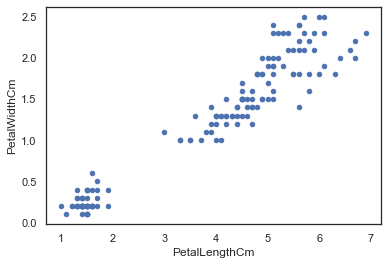
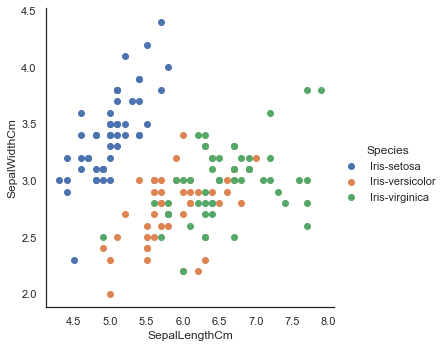
数据可视化 我们可以直接通过 pandas dataframe 的 plot() 函数进行 scatter 散点图绘制
1 2 3 iris.plot(kind="scatter" , x="SepalLengthCm" , y="SepalWidthCm" ) iris.plot(kind="scatter" , x="PetalLengthCm" , y="PetalWidthCm" )
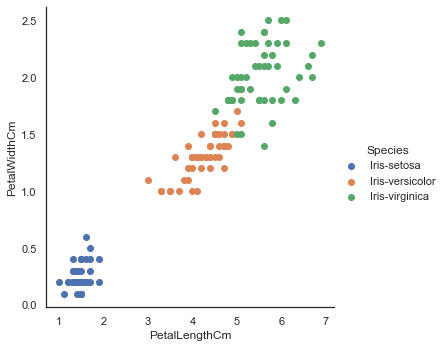
由下图的左下角推测我们可能可以直接通过花瓣分辨出一个物种(不过目前我们暂时还不知道这个物种是什么)。另外,我们可以观察到花瓣长宽之间有着很强的线性关系。
seaborn 我们先来大体介绍一下 seaborn 库的方法:
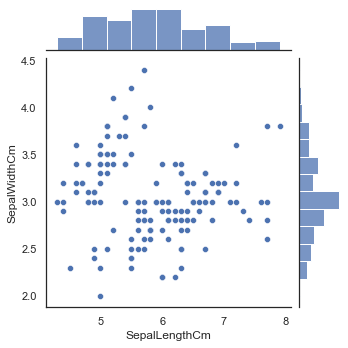
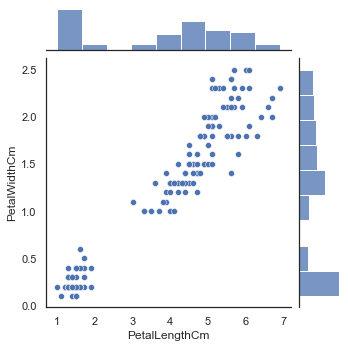
通过 joinplot() 函数来进行类似刚才的图像绘制, 同时还可以在旁边添加直方图
1 2 sns.jointplot(x="SepalLengthCm" , y="SepalWidthCm" , data=iris, size=5 ) sns.jointplot(x="PetalLengthCm" , y="PetalWidthCm" , data=iris, size=5 )
与刚刚的图像稍微有点不同,joinplot还可以在旁边显示出直方图。
下面把物种信息也可视化
1 2 3 4 5 6 sns.FacetGrid(iris, hue="Species" , size=5 ) .map (plt.scatter, "SepalLengthCm" , "SepalWidthCm" ) .add_legend() plt.show() sns.FacetGrid(iris, hue="Species" , size=5 ) .map (plt.scatter, "PetalLengthCm" , "PetalWidthCm" ) .add_legend() plt.show()
不出我们所料,由花瓣长-宽信息 PetalLengthCm ,PetalWidthCm 我们就直接可以辨别一个物种 setosa。
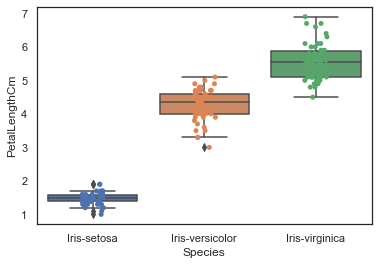
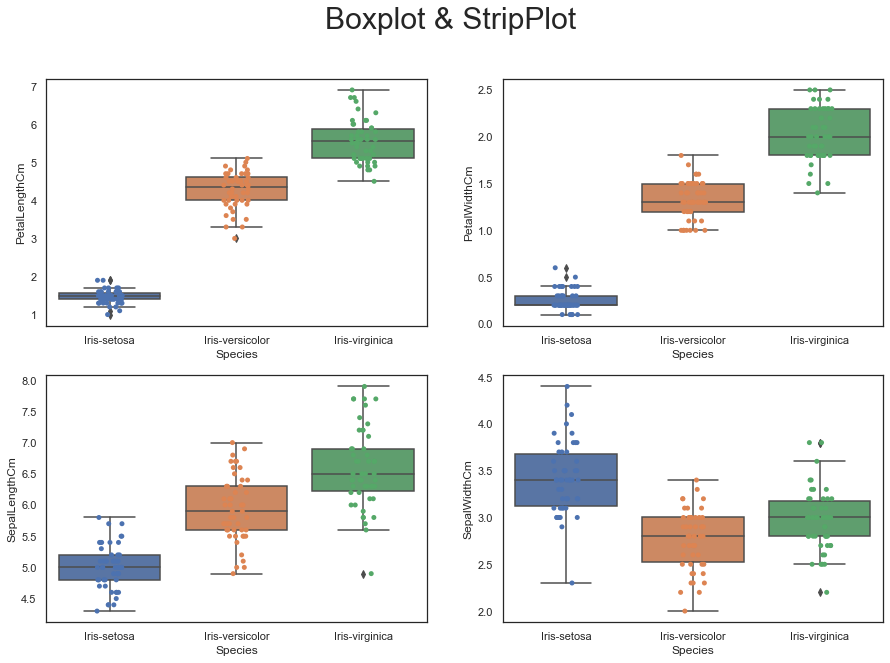
绘制箱型图使用 boxplot() 函数,使用 stripplot() 函数将在原有图的基础上叠加散点。
1 2 3 4 sns.boxplot(x="Species" , y="PetalLengthCm" , data=iris) sns.stripplot(x="Species" , y="PetalLengthCm" , data=iris, jitter=True , edgecolor="gray" ) plt.show()
1 2 3 4 5 6 7 8 9 10 11 12 13 14 15 16 plt.figure(figsize=(15 ,10 )) plt.suptitle("Boxplot & StripPlot" , size=30 , y=0.95 ) plt.subplot(2 , 2 , 1 ) sns.boxplot(x="Species" , y="PetalLengthCm" , data=iris) sns.stripplot(x="Species" , y="PetalLengthCm" , data=iris, jitter=True , edgecolor="gray" ) plt.subplot(2 , 2 , 2 ) sns.boxplot(x="Species" , y="PetalWidthCm" , data=iris) sns.stripplot(x="Species" , y="PetalWidthCm" , data=iris, jitter=True , edgecolor="gray" ) plt.subplot(2 , 2 , 3 ) sns.boxplot(x="Species" , y="SepalLengthCm" , data=iris) sns.stripplot(x="Species" , y="SepalLengthCm" , data=iris, jitter=True , edgecolor="gray" ) plt.subplot(2 , 2 , 4 ) sns.boxplot(x="Species" , y="SepalWidthCm" , data=iris) sns.stripplot(x="Species" , y="SepalWidthCm" , data=iris, jitter=True , edgecolor="gray" ) plt.show()
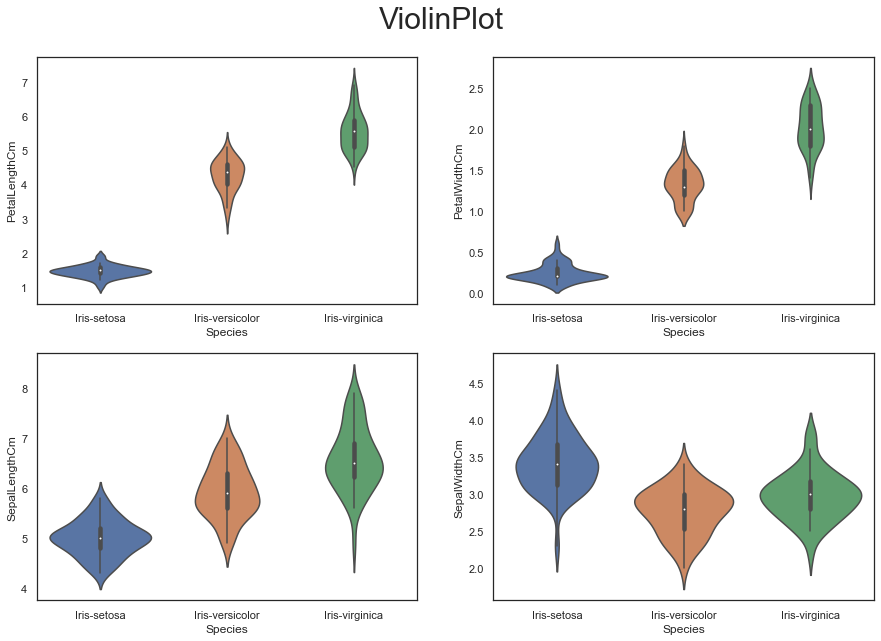
绘制箱型图使用 violinplot() 函数
1 2 3 4 5 6 7 8 9 10 11 12 plt.figure(figsize=(15 , 10 )) plt.suptitle("ViolinPlot" , size=30 , y=0.95 ) plt.subplot(2 , 2 , 1 ) sns.violinplot(x='Species' , y='PetalLengthCm' ,data=iris) plt.subplot(2 , 2 , 2 ) sns.violinplot(x='Species' , y='PetalWidthCm' ,data=iris) plt.subplot(2 , 2 , 3 ) sns.violinplot(x='Species' , y='SepalLengthCm' ,data=iris) plt.subplot(2 , 2 , 4 ) sns.violinplot(x='Species' , y='SepalWidthCm' ,data=iris) plt.show()
绘制核密度估计图
1 2 3 4 5 sns.FacetGrid(iris, hue="Species" , size=6 ) \ .map (sns.kdeplot, "PetalLengthCm" ) \ .add_legend() plt.show()
下面是双变量可视化方法:
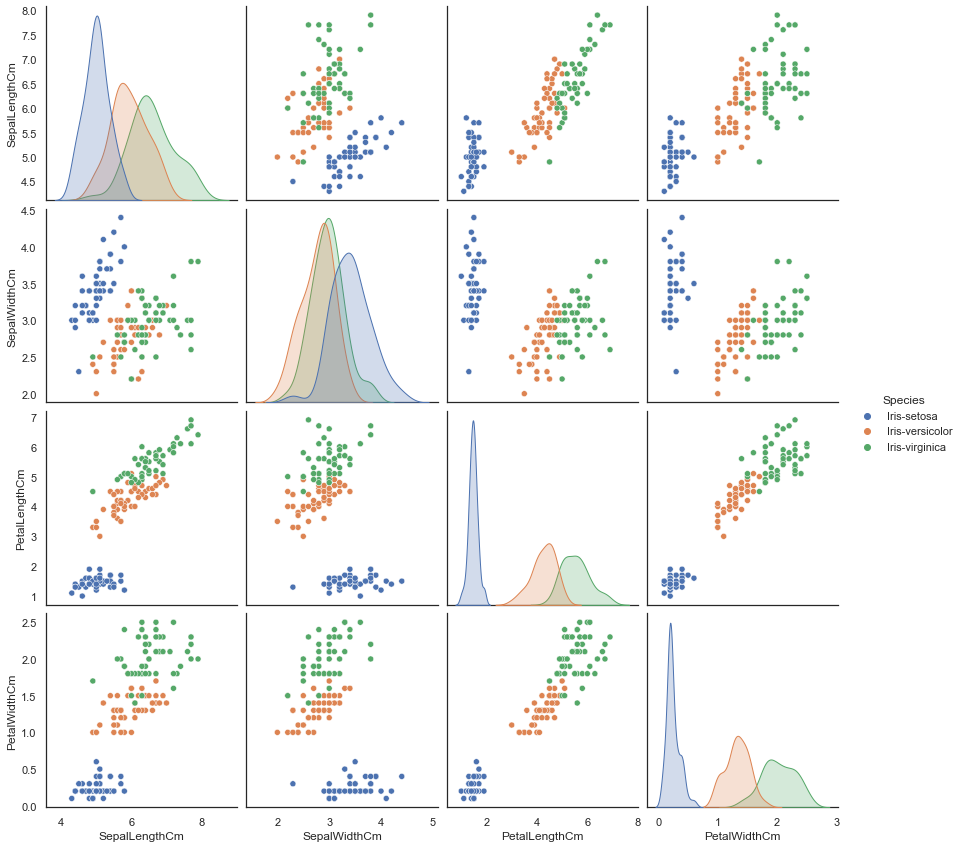
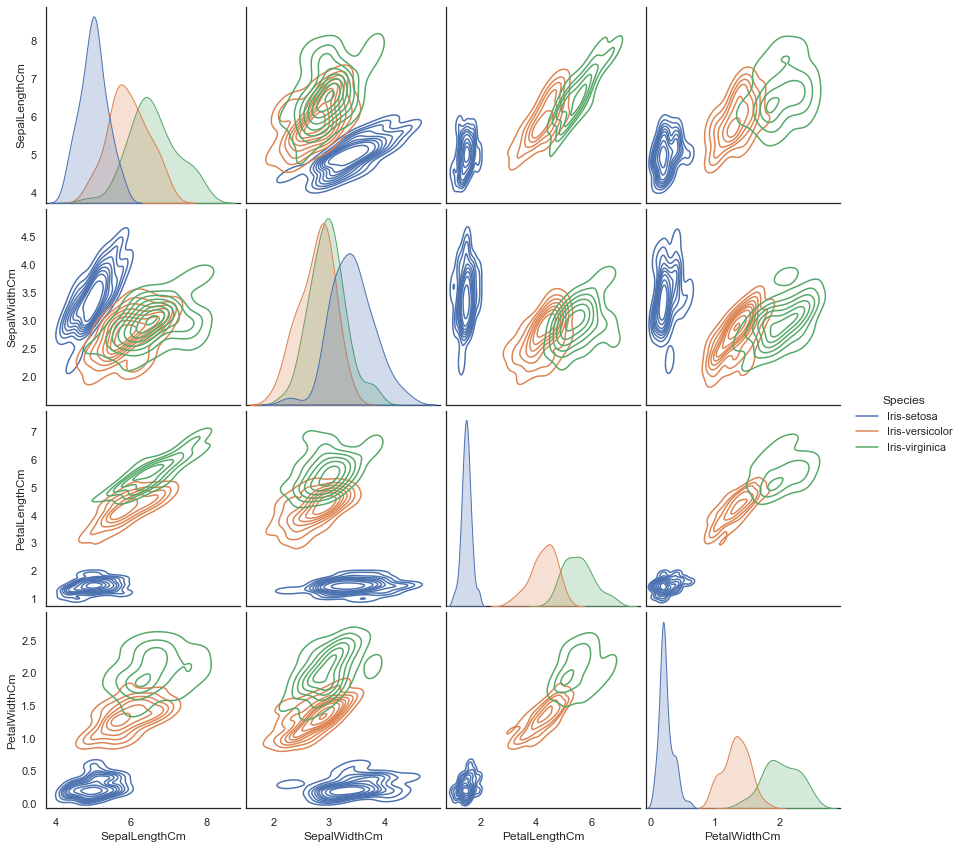
使用 paitplot() 方法绘制配对-核密度估计-散点图。
1 2 sns.pairplot(iris.drop("Id" , axis=1 ), hue="Species" , size=3 , diag_kind="kde" ) plt.show()
注意到我们使用到了 .drop() 函数,同时设定参数 axis=1 ,它表示将数据集里列名为 Id 的那一列信息都剔除之后剩下的数据。
大致介绍一下函数参数所代表的含义:
hue 表示标签diag_kind 控制对角线上图像的绘制。默认 auto, 还有 hist ,kde, None kind 控制非对角线上图像的绘制。默认 scatter, 还有 kde,hist,reg 此外还可以用 palette 设置标签颜色
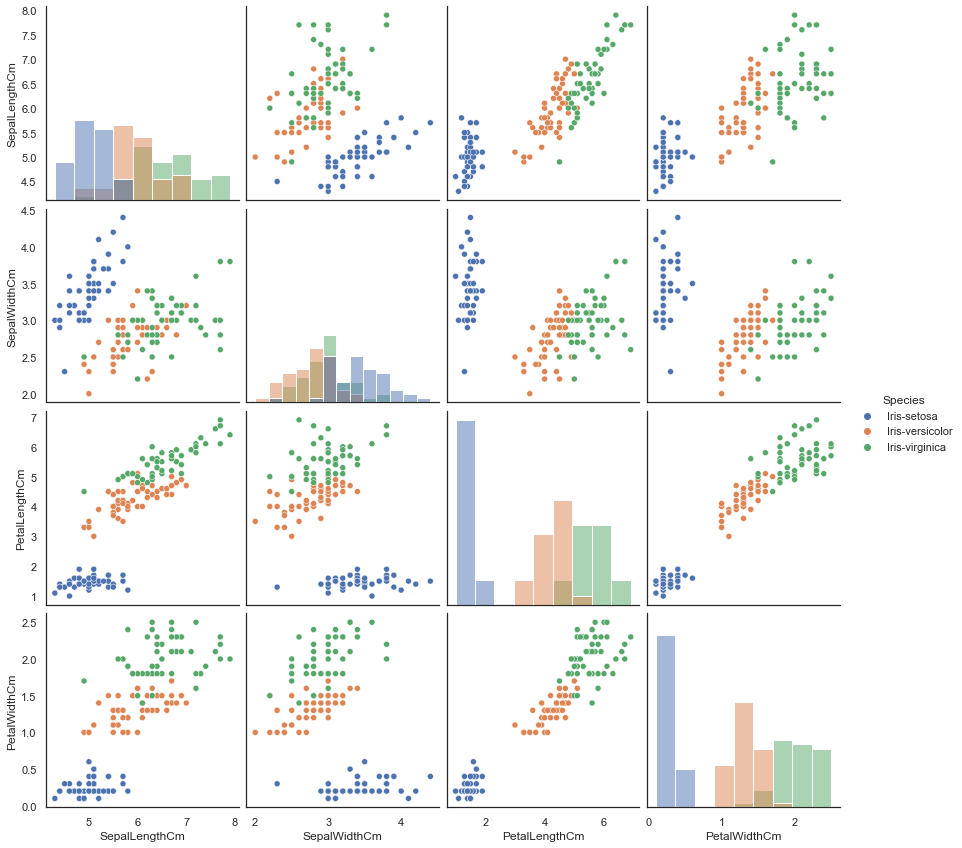
更改参数 diag_kind 为 hist 绘制配对-直方-散点图
1 2 sns.pairplot(iris.drop("Id" , axis=1 ), hue="Species" , size=3 , diag_kind="hist" ) plt.show()
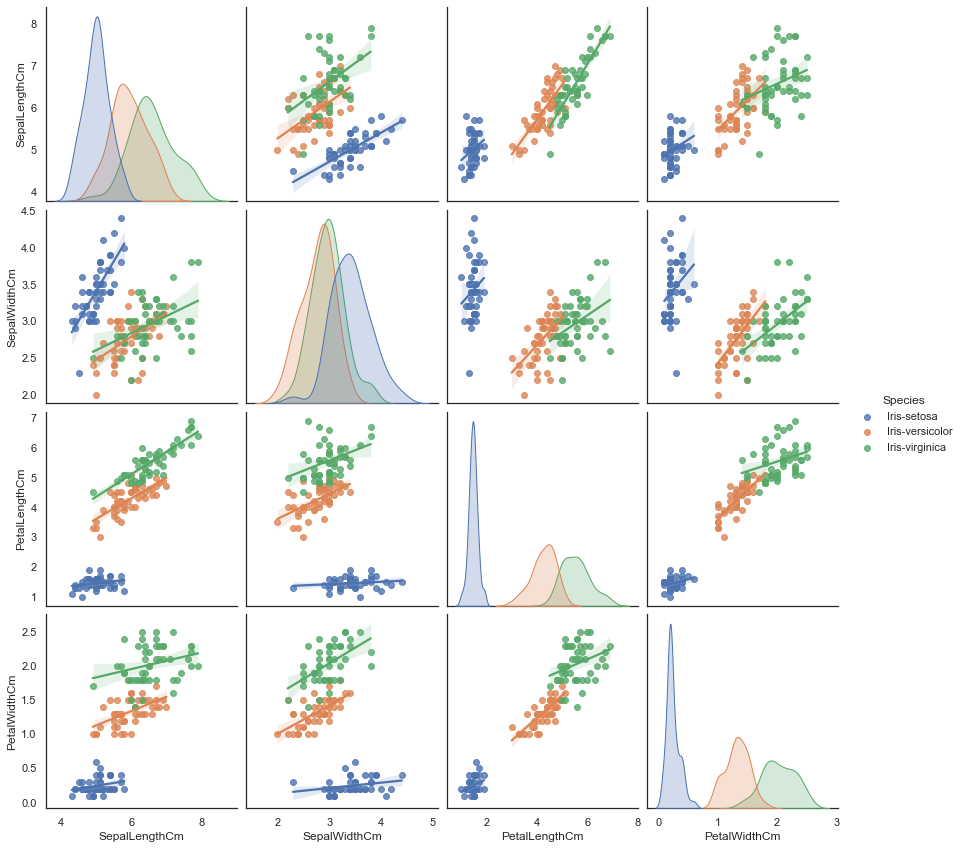
除了对角线上的图形,我们通过 kind 参数更改非对角线上图的绘制,例如:
1 2 3 4 sns.pairplot(iris.drop("Id" , axis=1 ), hue="Species" , size=3 , diag_kind="kde" , kind="reg" ) plt.show()
1 2 3 4 sns.pairplot(iris.drop("Id" , axis=1 ), hue="Species" , size=3 , diag_kind="kde" , kind="kde" ) plt.show()
(不过这些图看起来越来越花里胡哨了。。。
最后我们再介绍相关系数矩阵图 heatmap() 绘制方法
annot 参数控制是否在格子中显示数据, True 显示cmap 参数用于调整颜色
1 2 3 4 5 6 7 8 plt.figure(figsize=(7 , 4 )) sns.heatmap(iris.loc[:, 'SepalLengthCm' :'PetalWidthCm' ].corr(), annot=True , cmap=sns.diverging_palette(10 , 220 , sep=80 , n=7 )) plt.title("HeatMap" , size=20 ) plt.show()
那么以上 seaborn 库的方法就已经大致介绍完了,接下来是一些 pandas 库的方法。
pandas 先是平平无奇的箱线图 boxplot() 绘制
1 2 iris.drop("Id" , axis=1 ).boxplot(by="Species" , figsize=(12 , 6 )) plt.show()
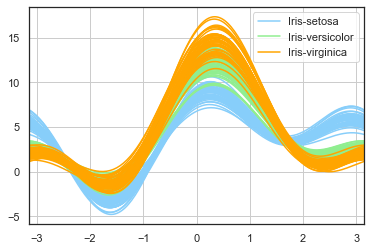
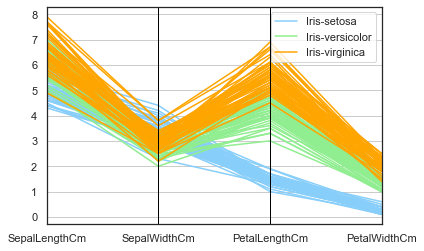
此外我们还可以使用一些多维可视化方法例如Andrews曲线以及平行坐标方法。
1 2 3 4 5 from pandas.plotting import andrews_curves, parallel_coordinatesandrews_curves(iris.drop("Id" , axis=1 ), "Species" , color= ['lightskyblue' ,'lightgreen' ,'orange' ]) plt.show()
1 2 3 4 parallel_coordinates(iris.drop("Id" , axis=1 ), "Species" , color= ['lightskyblue' ,'lightgreen' ,'orange' ]) plt.show()
到这里,我们的数据可视化工作就已经进入到尾声了。
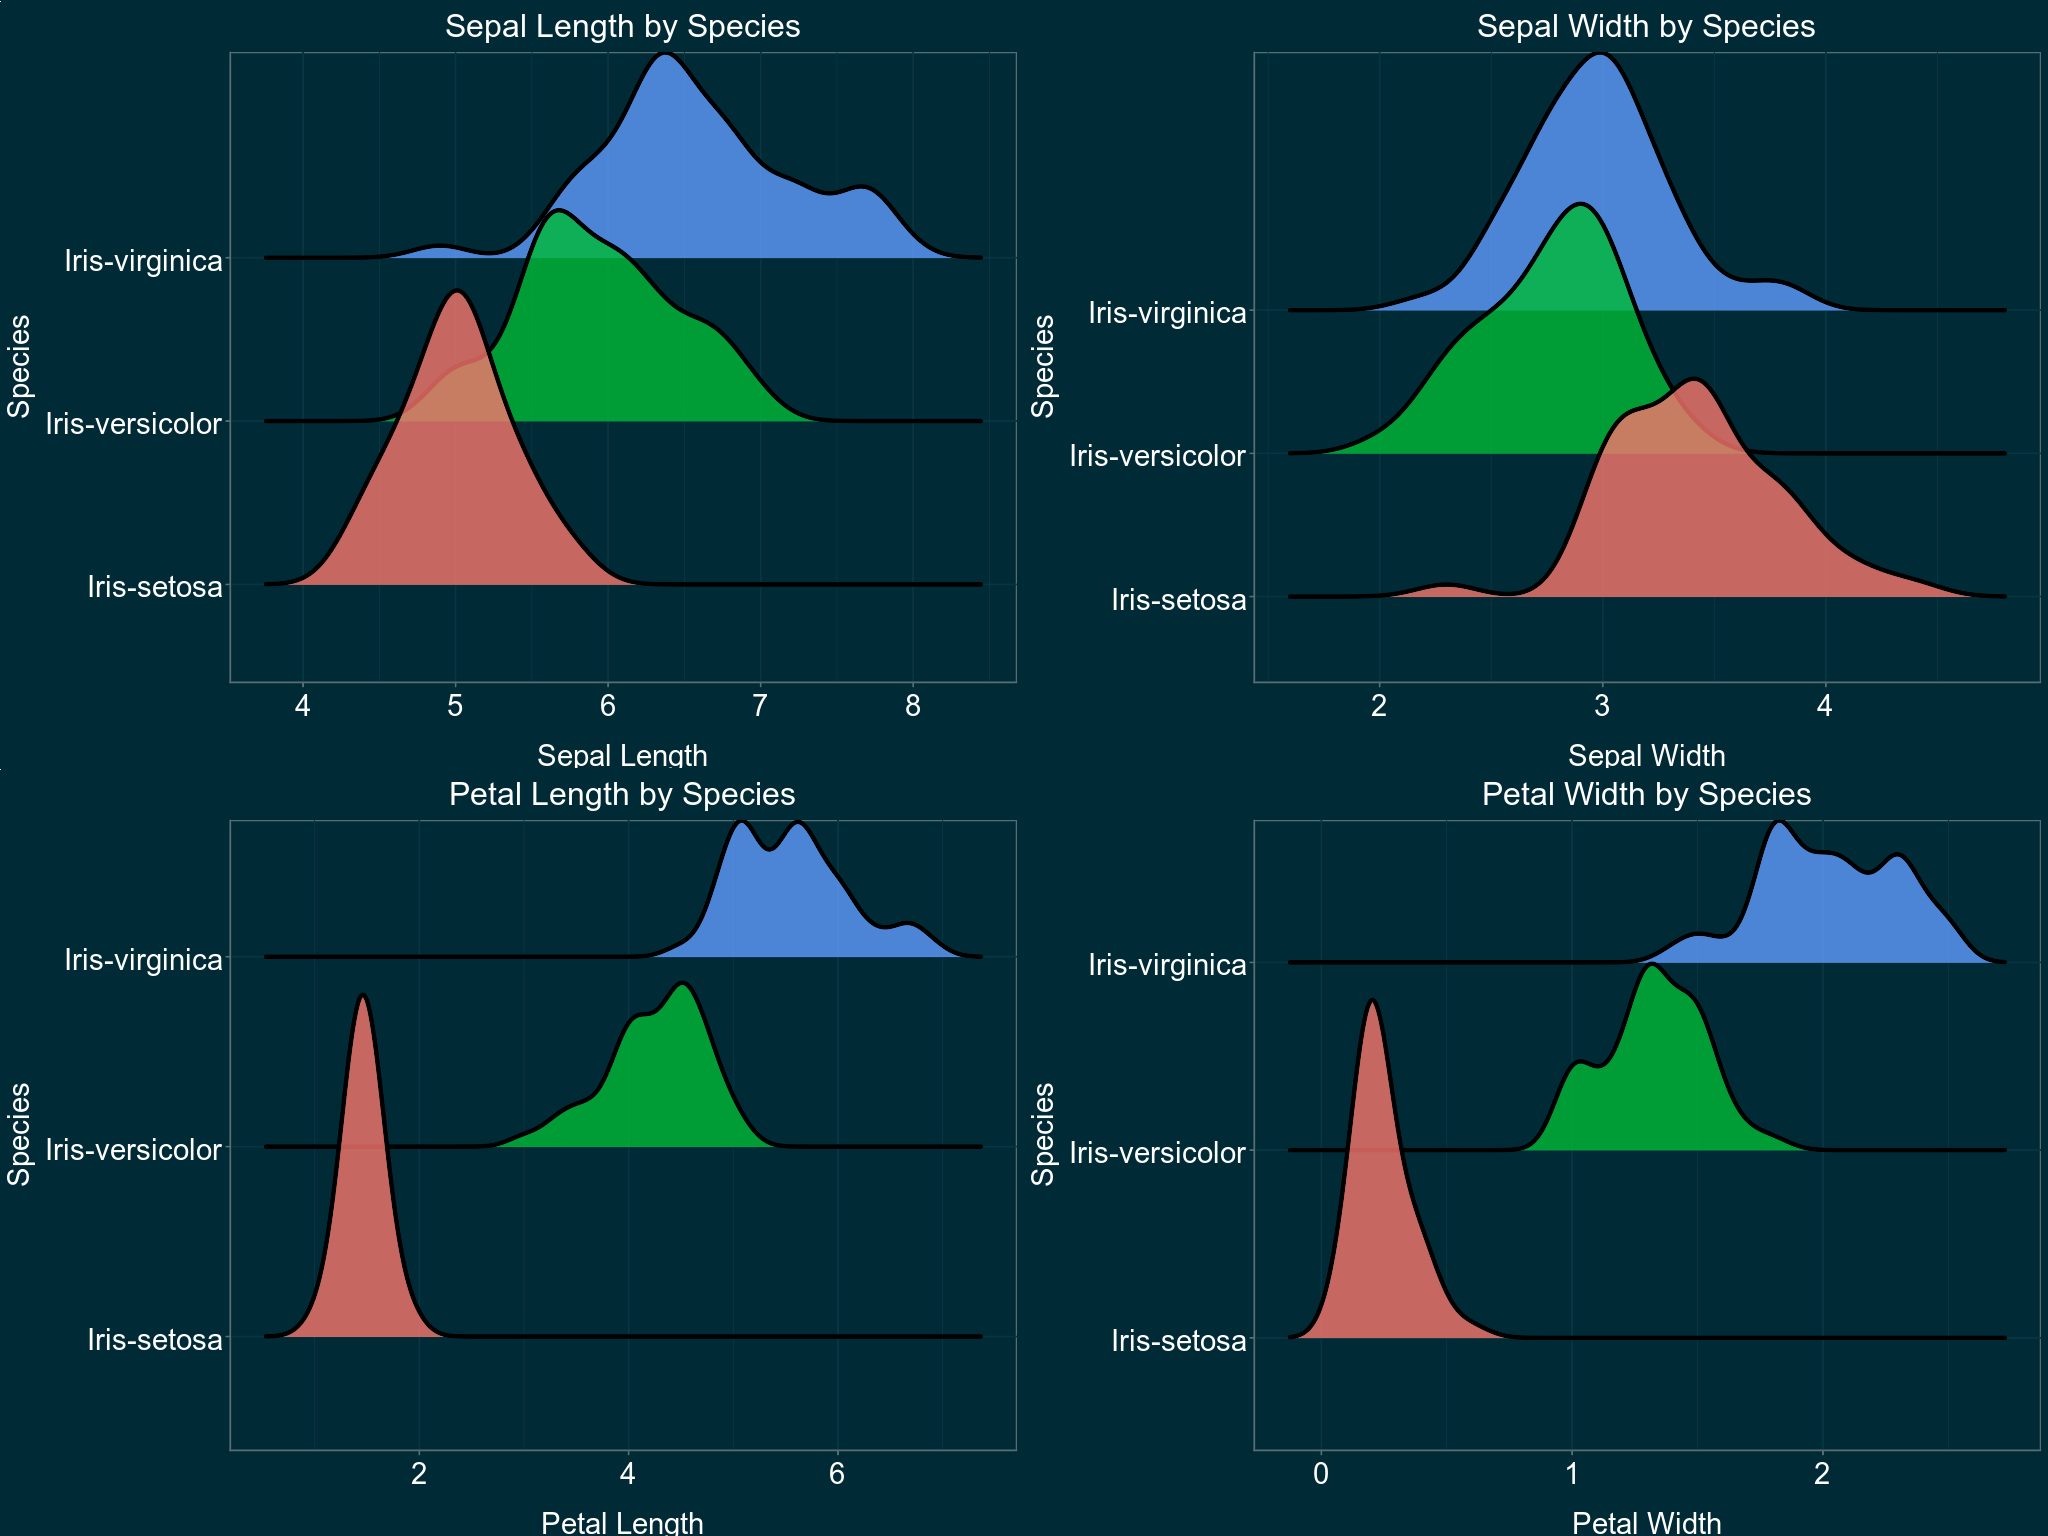
嵌入R代码进行可视化 在Basic visualization techniques | Kaggle 上我看到了关于这个数据集非常精致的一种可视化方法
是不是挺惊艳的?
可惜这是用R实现的,而且由于 ggplot 的部分功能并没有在python对应的 plotnine 实现,所以最终我选择了在python中嵌入R代码实现 ggplot 可视化功能这一十分愚蠢而猥琐的方法。
首先导入我们所需要的库
1 2 3 4 from io import BytesIOimport PIL.Image as Imageimport rpy2.robjects as robjects
我们将R代码保存在 r_scripts 中,然后使用 robjects.r() 运行该部分代码
1 2 3 4 5 6 7 8 9 10 11 12 13 14 15 16 17 18 19 20 21 22 23 24 25 26 27 28 29 30 31 32 33 34 35 36 37 38 39 40 41 42 43 44 45 46 47 48 49 50 51 52 53 54 55 56 57 58 59 60 61 62 63 64 65 66 67 68 69 r_scripts = """ install.packages('ggthemes') install.packages('tidyverse') install.packages('ggridges') install.packages('cowplot') install.packages('magick') library(ggthemes) library(tidyverse) library(ggridges) library(cowplot) library(magick) getwd() setwd("C:/Users/xzy79/OneDrive/DISCIPLINE/DATA/Iris") dados <- read.csv('iris.csv') tema <- theme(plot.title=element_text(size=24, hjust=.5, vjust=1, color="white"), axis.title.y=element_text(size=22, vjust=2, color="white"), axis.title.x=element_text(size=22, vjust=-1, color="white"), axis.text.x=element_text(size=22, color="white"), axis.text.y=element_text(size=22, color="white"), legend.position="None") options(repr.plot.width=17, repr.plot.height=13) sepallength <- ggplot(data = dados, mapping = aes(x = SepalLengthCm, y = Species)) + geom_density_ridges(mapping = aes(fill = Species), bandwidth=0.181, color = "black", size = 1.5, alpha = .8) + theme_solarized(light=FALSE)+ scale_colour_solarized('blue')+ xlab("Sepal Length") + ggtitle("Sepal Length by Species") + tema sepalwidth <- ggplot(data = dados, mapping = aes(x = SepalWidthCm, y = Species)) + geom_density_ridges(mapping = aes(fill = Species), bandwidth=0.134, color = "black", size = 1.5, alpha = .8) + theme_economist() + theme_solarized(light=FALSE)+ scale_colour_solarized('blue')+ xlab("Sepal Width") + ggtitle("Sepal Width by Species") + tema petallength <- ggplot(data = dados, mapping = aes(x = PetalLengthCm, y = Species)) + geom_density_ridges(mapping = aes(fill = Species), bandwidth=0.155, color = "black", size = 1.5, alpha = .8) + theme_economist() + theme_solarized(light=FALSE)+ scale_colour_solarized('blue')+ xlab("Petal Length") + ggtitle("Petal Length by Species") + tema petalwidth <- ggplot(data = dados, mapping = aes(x = PetalWidthCm, y = Species)) + geom_density_ridges(mapping = aes(fill = Species), bandwidth=0.075, color = "black", size = 1.5, alpha = .8) + theme_economist() + theme_solarized(light=FALSE) + scale_colour_solarized('blue') + xlab("Petal Width") + ggtitle("Petal Width by Species") + tema figure <- image_graph(width = 2048, height = 1536, res = 96) print(plot_grid(sepallength, sepalwidth, petallength, petalwidth, ncol=2, nrow=2)) image <- image_write(figure, path = NULL, format = "png") image_write(figure, path = 'ridgeline.png', format = 'png') """ robjects.r(r_scripts)
在刚刚的R代码中,我们将图像保存在png文件中,读取之后用 imshow() 输出图像
1 2 3 4 5 6 7 8 9 10 11 image_data = robjects.globalenv['image' ] image = Image.open (BytesIO(bytes (image_data))) plt.figure(dpi=1000 , figsize=(8 , 6 )) plt.imshow(image) plt.axis('off' ) plt.show()
数据分析 同样地,我们先导入必要的库
1 2 3 4 5 6 7 from sklearn.model_selection import train_test_split from sklearn.linear_model import LogisticRegression from sklearn import metricsimport statsmodels.api as sm from IPython.core.interactiveshell import InteractiveShell InteractiveShell.ast_node_interactivity = "all"
数据集切分 利用 sklearn 函数 train_test_split() 将数据集分成训练数据集和测试数据集
1 2 3 train, test = train_test_split(iris, test_size=0.3 )
然后设定自变量和响应变量
1 2 3 4 train_X = train.loc[:, 'SepalLengthCm' :'PetalWidthCm' ] train_y = train.Species test_X = test.loc[:, 'SepalLengthCm' :'PetalWidthCm' ] test_y = test.Species
或者,我们也可以将两个步骤合起来
1 2 3 X = iris.loc[:, 'SepalLengthCm' :'PetalWidthCm' ] y = iris.Species train_X, test_X, train_y, test_y = train_test_split(X, y, test_size=0.3 )
如果你已经忘记了,那么再次提醒一下.loc[:, 'SepalLengthCm':'PetalWidthCm']和 .drop("Id", axis=1)都可以达到同样的效果。
逻辑回归(sklearn)
题外话 居然可以把逻辑回归 翻译成逻辑斯蒂回归 ,真不知道是哪个小天才音译的,也是够可以的,一点逻辑都没有,听起来又蠢又拗口……(还有把 Robust 翻译成鲁棒性,服了……)
逻辑回归是一种广义线性模型,它在传统的回归模型的基础上通过一个联系函数将值域映射到 $[0,1]$ 区间。(等有空我可以来写写线性回归模型还有广义线性模型的一些思想和理论)
我们先大致介绍一下sklearn中的模型LogisticRegression()的一些参数
penalty表示惩罚项(正则化参数),可选为 l1 ,l2 默认为 l2 。在传统线性模型中,这两种惩罚项实际上是对应着不同的最优化问题。C是大于 0 的浮点数。C越小对损失函数的惩罚越重solver指定求解方式。可选有liblinear (梯度下降法),lbfgs (大型BFGS方法),newton-cg (牛顿-CG方法),sag (随机梯度下降),saga (随机梯度下降的优化)
话不多说,开始训练。
首先进行全变量模型的回归拟合
1 2 3 4 5 6 7 lreg = LogisticRegression() lreg.fit(train_X, train_y) lreg_pred = lreg.predict(test_X) print ("The accuracy of the Logistics Regression is" , metrics.accuracy_score(lreg_pred, test_y))
结果显示预测精度达到 。
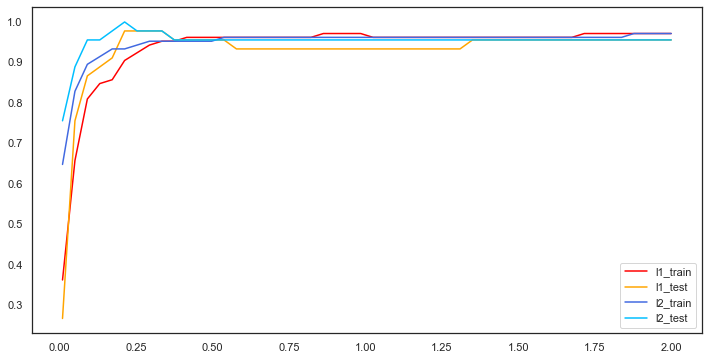
接下来引入L1,L2惩罚项,我们来比较这两种方法的差异。
1 2 3 4 5 6 7 8 9 10 11 12 13 14 15 16 17 18 19 20 21 22 23 24 25 26 27 28 29 30 31 32 33 34 lreg_l1 = LogisticRegression(penalty="l1" , C=0.5 , solver="liblinear" ) lreg_l2 = LogisticRegression(penalty="l2" , C=0.5 , solver="liblinear" ) lreg_l1.fit(train_X, train_y) lreg_l2.fit(train_X, train_y) l1_train_pred = [] l2_train_pred = [] l1_test_pred = [] l2_test_pred = [] for c in np.linspace(0.01 , 2 , 50 ): lreg_l1 = LogisticRegression(penalty="l1" , C=c, solver="liblinear" , max_iter=1000 ) lreg_l2 = LogisticRegression(penalty="l2" , C=c, solver="liblinear" , max_iter=1000 ) lreg_l1.fit(train_X, train_y) l1_train_pred.append(metrics.accuracy_score(lreg_l1.predict(train_X), train_y)) l1_test_pred.append(metrics.accuracy_score(lreg_l1.predict(test_X), test_y)) lreg_l2.fit(train_X, train_y) l2_train_pred.append(metrics.accuracy_score(lreg_l2.predict(train_X), train_y)) l2_test_pred.append(metrics.accuracy_score(lreg_l2.predict(test_X), test_y)) data = [l1_train_pred, l1_test_pred, l2_train_pred, l2_test_pred] label = ["l1_train" , "l1_test" , "l2_train" , "l2_test" ] color = ['red' , '#FFA500' , '#4169E1' , '#00BFFF' ] plt.figure(figsize=(12 , 6 )) for i in range (4 ): plt.plot(np.linspace(0.01 , 2 , 50 ), data[i], label=label[i], color=color[i]) plt.legend(loc="best" ) plt.show()
在很久以前,L2惩罚项是比较受到统计学家的青睐的,这是由于它涉及参数向量模长的平方,在计算过程中比较方便,相比之下,L1惩罚项是参数各分量的绝对值之和,会产生导数不连续的点。但随着计算机的发展,类似L1惩罚项这种计算已经不会成为一种困扰,同时L1惩罚项所对应的参数向量具有稀疏性的特点,所以L1惩罚项也变得越来越受人们的关注和使用。
另外,在这里我还要提及一点,这可能也会是一些人的认识误区——那就是原本的模型和加了L1或者L2惩罚项的模型之间是否有着绝对的优劣之分。需要澄清的是,我们在统计上进行模型比较时,一定是在某个准则下来谈孰优孰劣的问题的,不同准则下得出的优劣比较结果可能不同。这里面涉及到两个问题,一是准则是否合理,是否符合实际情况,二是我们事先对数据做出的一些假定是否合理。这两个问题如果无法得到肯定的回答,那么我们就无法真的选出所谓“最优的”模型。
举个例子,我们考虑传统的线性回归模型,假定数据的噪声满足正态分布 ,那么在均方误差最小化的准则 下,我们的最优解就是最小二乘解。此时若是有人说加了L2惩罚项或是什么牛鬼蛇神的模型更好,那么你就知道他一定是在吹大牛。而假定数据的可加噪声为拉普拉斯噪声,那么(忘了在什么准则下的)最优解就是L1正则化模型所对应的解。
逻辑回归(statsmodels) 我们利用statsmodels模块中的广义线性模型来进行模型拟合。
首先自定义多元逻辑回归函数
1 2 3 4 5 6 7 8 9 def logitRegression (data, train_test_split ): trainSet, testSet = train_test_split(data, test_size=0.2 ) lreg = trainModel(trainSet) modelSummary(lreg) interpretModel(lreg) lreg = makePrediction(lreg, testSet)
(evaluation()函数功能尚未完成)
其中调用的自定函数功能如下所示:
函数名
功能
trainModel
训练模型
modelSummary
模型统计分析
interpretModel
模型解释
makePrediction
模型预测
evaluation
模型评价
1 2 3 4 5 6 7 8 def trainModel (data ): """ 搭建逻辑回归模型,并且训练模型 """ formula = "Species_code ~ SepalLengthCm + SepalWidthCm + PetalLengthCm + PetalWidthCm" model = sm.GLM.from_formula(formula, data=data) lreg = model.fit() return lreg
在这里我们调用sm模块的GLM.from_formula()方法,然后将我们要拟合的形式保存在formula变量中作为参数输入。
1 2 3 4 5 6 7 8 9 10 11 def modelSummary (lreg ): """ 分析逻辑回归模型的统计特性 """ print (lreg.summary()) A = np.identity(len (lreg.params)) A = A[1 :,:] print ("检验所有参数是否显著不为0:" ) print (lreg.f_test(A))
在这里我们使用f_test()函数检验模型整体的显著性 ,也即所有参数是否显著的不为0 。倘若检验的结果显示模型整体参数显著的不为0,那么我们也就没有必要使用这些变量进行模型拟合了,因为这些变量并不能对解释响应变量产生任何作用。
(未完待续)
